Business process modeling has become a classic work of many business analysts as part of the optimization of business processes and the standardization of activities. Russian companies. There are many notations that are used in certain cases. This article is devoted to an overview of business process modeling notations.
VAD (value added chain diagram)
The VAD notation proposed by Michael Porter in his work on corporate strategy focuses on modeling business processes that "create value" in the form of services or products for the customer. A business process model built in VAD notation provides a general, non-detailed view of business processes.
Using the VAD notation, you can describe the list and the relationship of business processes at the top level, since this notation allows you to display all the company's business processes on one model. In the VAD notation, you can use relationships that show the relationship of business processes relative to each other, while the flow of the process in this notation in the vast majority of cases is directed from left to right.
There are a lot of VAD notation options implemented in various tools, each with its own character set, but they all look about the same - a set of business processes often interconnected by “predecessor-follower” links.
For example, the extension of this notation in the ARIS toolkit allows you to show performers, risks, documents, data, and much more on the business process model.
In addition to modeling an organization's business process map, VAD notation allows you to model end-to-end business processes during their initial definition. But you need to understand that VAD is not designed to model the logical conditions in the process, and therefore it is well accepted by management. In practice, after modeling business processes at the top level in the VAD notation, more detailed modeling of business processes in other notations follows, which we will discuss in more detail below.
The VAD notation model can be drawn in a variety of tools such as MS Visio and many other business process modeling tools.

Business process modeling - EPC (event-driven process chain)
The EPC notation was developed by Professor August Wilhelm Scheer within the framework of the ARIS toolkit methodology. With the help, a business process is modeled as a list of process steps triggered by events. The notation is convenient for the subsequent regulation of the business process, as well as for analyzing the information flow of the business process (incoming/outgoing documents).
The freedom of the EPC notation allows you to describe additional objects within the framework of business process modeling, such as operational risks, control procedures, screen forms, Information Systems, indicators and much more.
Within the framework of the EPC notation, the process is modeled “top-down”, and the order in which steps/functions/actions/operations of a business process are performed is determined through a system of events and logical conditions. As events in the EPC notation, the beginning and completion of process steps, as well as external events that require a response from the organization, are considered.
The business process model consists of "event-function-event" sequences and logical operators "AND", "OR", "exclusive OR" that display solutions, condition checking, parallelization and convergence of the flows of the modeled business process.
There are many options for EPC notation, in the format of columns, rows, as well as with different lists of objects used, however, all these options are available only in the ARIS toolkit, while in other tools, for example, MS Visio or Business Studio, only EPC business process modeling is available. in classic format.
Modeling a business process in EPC notation allows you to subsequently obtain a text or tabular business process regulation, since a correctly drawn EPC model can be converted into a sequence of ordinary language sentences, which becomes the basis for the regulation. That is why this notation is considered the most convenient for modeling business processes for the purpose of subsequent analysis and regulation.
Modeling business— processes– BPMN (Business Process Model and Notation 2.0)
The BPMN notation was created by the Object Management Group (OMG) and is intended for modeling business processes with a view to their subsequent automation. The BPMN notation is used for detailed modeling of a business process, and the number of objects in this notation exceeds 100, which allows you to describe all the nuances of the behavior of business processes so that the information system can convert the created model into executable code.
The openness of the BPMN notation and support by most business process modeling and automation tools have made this notation a leader in business process modeling.
In BPMN notation, in addition to business process steps, you can model start, intermediate and final process events, information flows and message flows. Among the features of the notation, one can single out the default use of the Swim Lane modeling style (swimming lanes), when the performer is shown as a vertical or horizontal strip resembling lanes in a swimming pool, and it is on this track that the actions / operations performed by this performer are located.

Streamlining a business process in the Swim Lane format makes the transfer of responsibility and work flow between process participants visual, but at the same time, it makes modeling difficult in the case of several co-executors in one operation.
Models drawn in BPMN notation are often difficult to assemble into a coherent hierarchy, since the methodology was originally created to automate "end-to-end" business processes.
Applying BPMN notation requires a certain amount of experience, which often limits the number of creators of these models to systems and business analysts. Representatives of business units rarely model business processes in BPMN notation.
Despite the graphical differences, the BPMN and EPC notations are very similar to each other, and in the ARIS toolkit they can already be converted to each other, albeit with certain methodological limitations.
Business Process Modeling - Flow Charting
The name of the notation is Flow Charting, it is easiest to translate as flowcharts. This notation originally appeared in the ANSI standard in 1970, and contains a very simple set of characters.
Over the years of the existence of the Flow Charting notation, many variants of flowcharts have been drawn containing symbols for solving various problems, for example, to describe material flows, roles and jobs, equipment, to analyze the inputs and outputs of functions.
In fact, flowcharts were the forerunners of modern business process modeling notations, and up until now have been taught in most educational institutions within the disciplines dedicated to information technology.
The Flow Charting notation does not have a rigid standard, which allows you to model business processes from different points of view, adding certain objects to the model as needed. In this way, this notation is very similar to EPC, but has even more freedom in terms of application. The freedom to use Flow Charting and the support of most inexpensive and even free business process modeling tools has made this notation applicable in many companies.
Among the shortcomings of Flow Charting, one can single out the absence of a typical list of objects and attributes, which is the reverse side of the "freedom" of this notation. This allows you to model the same business process in this notation in such a way that the models will be seriously different from each other.
Despite the fact that business process models in the Flow Charting notation can be found quite often, most likely it will become a thing of the past, giving way to more “strict notations”
Modeling business— processes– IDEF (Integrated Definition Language)
IDEF notation originated in the 1970s as a US government standard focusing on the inputs, outputs, mechanisms, and controls of a business process and linking an organization's processes into a hierarchy. The key element of this notation is the function, while all other objects and interactions are modeled using relationships.
The notation uses a very simple set of symbols: process rectangles and arrows depicting inputs, outputs, controls and mechanisms, this notation is distinguished by a “built-in” numbering system for business process steps, which allows you to trace the relationships between parent and child processes.
Given the history of this standard and its fairly widespread use, it is implemented in many modeling tools, but still this notation can be attributed to the outgoing generation, since it has fewer and fewer supporters, and business representatives often treat these "microcircuits" with skepticism.
UML (unified Modeling Languages)
The Unified Modeling Language (UML) is a set of notations and modeling methods designed to describe the requirements for information systems, but among the UML notations there is also a specialized notation designed specifically for modeling business processes. UML is supported by the Object Management Group (OMG), which has made this methodology quite common among IT professionals.
This notation is very similar to EPC and BPMN, the only difference is in the display of logical statements and events, and although there are many books on UML notation and it is supported by many modeling tools, UML Activiti Diagram is used mainly for systems analysis and design, and only a minor number of companies use UML to model business processes
VSM (value Stream Mapping)
The name of the VSM notation can be translated into Russian as mapping the customer value stream. original name this notation in the Toyota Corporation, where it is believed that it was invented - Map of the flow of materials and information.
The VSM notation was developed as part of the methodology lean manufacturing, and uses a set of specific symbols to display elements of resource and time costs to analyze the effectiveness of a business process in Lean 6Sigma projects. A value stream map depicts the physical environment and the flow of materials and products in a manufacturing process and is used to tie resource and time costs to a process and thus provide insight into performance
The purpose of this notation is to involve its participants in the analysis of the business process in order to encourage them to independently search for optimization opportunities. As a rule, VSM models are drawn in projects on Flip Chart and do not require serious business process modeling tools, because decisions are made on its basis, and the model itself does not become the basis for either the regulation or the IT solution.
The main thing when creating a model in VSM notation is filling in temporary attributes by process, to search for "bottlenecks" and places of excessive storage of stocks.
This notation has a limited circle of followers, and among the broad masses of business analysts it will not be widespread in the near future due to the specificity of the tasks solved with its help. But at the same time, many business process modeling tools, such as ARIS, have already developed extensions to support business process modeling in this notation.
SIPOC
The abbreviation SIPOC means: Supplier (supplier), Input (input), Process (process), Output (output), Customer (consumer). This is a process documentation template adopted in the Six Sigma methodology, in fact, it is not even a model notation, but a table format that allows you to describe a business process at the top level. The SIPOC model is most effectively applied when defining business process boundaries, interacting parties, and process inputs/outputs.
There is no notation for SIPOC, because it is a simple table with appropriate headers that allows you to structure the selected business process for further analysis and optimization.
The usefulness of SIPOC, unlike other diagrams, lies in the possibility of its use by employees of business units, since it does not contain complex logic and many objects, like EPC or BPMN notations.
Business Process Modeling - Conclusions
So, I looked at some business process modeling notations that can be found on Russian market(They are described in more detail in the BPM CBOK chapter on business process modeling). Which of the notations to choose for use is an open question, for example, for modeling the business processes of an organization at the top level, I use the VAD notation, for the primary modeling of a business process selected for optimization, it is easier to use SIPOC or VAD. To create detailed models of business processes - a simplified BPMN for modeling cross-functional interaction or EPC for detailed modeling in order to formalize the information flow and the set of objects associated with a business process. Well, if you need to automate a business process in a BPMS system, then you can’t do without BPMN notation.
The world has been dealing with the process approach to business organization for a long time and quite effectively, and the Business Process Model and Notation (BPMN, notation) standard is a well-thought-out procedure correct description business processes. Companies are constantly improving various specializations of this standard and thereby achieve a very significant increase in all quality indicators of their work. BPMN notation is understandable not only for experts of the subject area in which it was created, any worker can operate with its logical calculations.
Modeling and standardization
Simultaneously with simplicity, this standardization is the most complete model the described business process in machine-readable form. BPMN (when viewed in the BPMN 2.0 version of the notation) builds models of the most complex processes in business in a very powerful and expressive way, and in the most understandable system. Most importantly, along with this standard, graphical models are defined and converted into a beautifully structured and machine-readable form that is based on XML. The BPMN notation language is absolutely executable, that is, it allows you to model processes that are subsequently performed using BPMS ( automated systems business process management). Such standardization is extremely useful precisely because modelers can use some software products, and performers - others, if they support this standard.
To build a certain model, more than one version can be used (BPMN 2.0 notation (PDF) and others), sometimes the model is made up of fragments of different notations, but the way they are systematized and read is the same. An increasing number of entrepreneurs are implementing in their companies the execution of business processes based on this standard. The demand for specialists who know this modeling language is growing every day. An increasing number of people are studying the graphic elements of BPMN notation and the rules for building models. For this, there are special courses where those who wish will get acquainted with the purpose of this language, with the types of diagrams, and see the possibilities of automatic execution of the built models. The most interesting thing is practical experience in BPMN 2.0 notation (also available in Russian), modeling and analysis, development of a business process.

Specialists
Who is capable of describing business processes? BPMN modeling notation is easily performed by anyone involved in automation, business process development. project managers, system analysts, architects and developers computer systems, methodologists, employees of quality services. Usually these people are able to read technical documentation in English, participated in any analysis projects, described BPMN notation, optimized or automated business projects, or developed and maintained software. This methodology has international status, and not branded, like many other standards, and not even national. That is why since 2005 they have been analyzing and reorganizing business using process modeling in BPMN notation.
This technique provided almost all users with accessible information - from the largest analysts who create schemes, and developers who implement technologies for executing business processes according to these schemes, to company executives, that is, ordinary users who are busy managing and monitoring the implementation of the built model. In this way, Business Process Modeling Notations (BPMN) bridge the gap between model creation and model implementation. Here are collected best ideas available in other methodologies. For example, for better flexibility and readability in BPMN 2.0 notation, it follows the flowchart tradition.

Symbols (elements) BPMN
Supports and develops BPMN organization OMG. This is not a meme of Internet regulars, meaning "oh mine goth", but the very famous Object Management Group, which includes more than eight hundred companies that develop standards like BPMN notation. We owe all the useful changes in new versions to the OMG developers. It was this organization that chose the promotion of the UML BPMN notation, which is used to model object-oriented systems, as a key direction. Therefore, when developing diagrams, in addition to concepts and concepts (control flow, action, data object, etc.), there are many concepts in BPMN that are characteristic of the object-oriented approach: message, exchange, and message flow.
Symbols of graphic notation are parsed according to their purpose and combined into categories. Objects - stream objects, Data - data, Swimlanes - areas of responsibility, Connecting Objects - connecting objects, Artifacts - artifacts. The control flow, data object, and flow object symbols are further subdivided into subgroups according to semantic features in order to display the specifics of ongoing events, flow branching features, execution of actions, and so on. They indicate the specifics due to additional graphic images - markers, icons placed inside the main symbol. Event symbols also come with different kind outline and background color.

Events by time
During the execution of a business process, various and numerous events always occur that have their impact, despite the fact that most often they are optional elements and are not displayed in the business process diagram. This is receiving and responding to a message, changing the status in documents, and much more that it makes no sense to list - a lot of events happen literally at every step. To classify them, the characteristics of each are determined. The first group - by the time of the onset. This is the start event that will show the beginning of the chart. From here, the control flow can only be outgoing, and the message flow can go both ways. The start event on the business process diagram is usually one, but you can not display it at all. Sometimes there are even several of them, if the mapping occurs with tracks, pools and deployed subprocesses. The outline of the event is shown as a thin single line.
An end event is the result of executing a business process. Here the flow of control only enters, and the flow of messages still moves both to the input and to the output. The incoming stream is represented by an arrow. The diagram displays only one end event or several - they are outlined as a thick single line. An intermediate event is any of the others that occur during the execution of a business process. One stream enters here and one exits too. Only Boundary (boundary event) occurs and is processed immediately - either at the very beginning or at the end of the action. It is displayed on the contour (border) of the action, and contains only one stream - either incoming or outgoing. And such an event is indicated by a thin double line.

Events: subprocess interruption and result type
Since the events during the modeling of a business process are very different, the next block was classified those that can interrupt the execution of an action. The first to be marked are non-interrupting events - these are intermediate or start events that occur during execution, however, initiate the outgoing thread associated with it only when the activity is completed. The contour of such an event is depicted by a dashed line. Next is a interrupting event that occurs before or after the standard action. In exceptional situations, this event requires a stop or termination of the action if the necessary information is missing or an error is shown during processing, if additional actions are needed, and the like. Here the outline is shown as a solid line.
The third kind of events is classified according to the type of result. First of all, here we need to talk about the processing initiator. This is an intermediate or start event that occurs as a result of the execution of actions and is the result of the execution of a process - standard or not. The triggering event is represented by an unfilled icon. It is necessary to add one more event to this section, which also speaks of performance, only here it is the result of processing. This is an intermediate or final event that occurs during the execution of actions and is one of the final results of the execution of the process - standard or not, it is displayed as a filled icon.
Actions
A process, depicted as a diagram, looks like an ordered set of actions that are performed to obtain a certain result. On a BPMN notation vertical diagram, from top to bottom, a sequence is specified showing the execution of a process over time. You can also trace it in the direction of the arrows of the connecting elements from left to right. The displayed actions have three main views and many varieties, each with its own icon or icon.
task - a task. Elementary action, that is, indivisible. The type or specificity of the task is indicated by a marker or icon in the upper left corner of the action symbol. The task can be Service (service), for the provision of a service, which is an automated application or web service. Send - send a message. If the message is sent at least once, the task can be considered completed. Receive - receiving a message (same principle: if a message is received once, the task is completed). The User's task is considered characteristic and is performed by the executor with the help of software and with the assistance of other employees. A task that requires manual execution is Manual, which is performed without the help of automation. Business-Rule - a business rule, according to technology, the fulfillment of this task depends on the circumstances, the choice of a method helps to set a business rule. Script - a script where the execution of operations is strictly in the order described in a language recognized by the performer. Typically, this kind of task is performed by automated means.
Subprocesses
Sub-Process - subprocess. It includes gateways in BPMN notation, workflows, events, and many other activities. Thus, a sub-process is a composite action, the parts of which are directly displayed inside the symbol on the diagram or are placed on a separate decomposition diagram. In the latter case, the main diagram should display a + sign at the center of the sub-process (lower edge of the activity). There are standard subprocesses, but they are not enough, so two specific varieties of it appeared. This is an Event Sub-Process - an event subprocess that always starts when a start event occurs. The diagram shows it in no way related to the rest of the activities and workflows. The contour of such a subprocess is depicted by dots.
The second variety is Transaction (transaction), this is an action consisting of different operations with a successful completion, that is, obtaining a positive result. You can get a specific result only if all the components are successfully completed. If problems occur during the execution of the subprocess, the results of all previous operations will be canceled (cancel event). Such interference may be the impossibility of performing a particular operation or its incorrect performance. To avoid canceling previous events, you can try a failed operation to compensate (event compensation). The outline of such a sub-process is shown as a double solid line. To include in the diagram all tasks or sub-processes that are reused, there is a Call - a call, which is indicated in the diagram by a bold outline.

Gateways
Gateways in BPMN notation are intended to indicate the specifics of the flow of operations and their passage through parallel or alternative branches. The gateway can do without outgoing or incoming flows, but always has at least two own either incoming or outgoing flows. The marker inside its symbol specifies the gateway type. It can be Exclusive, XOR - exclusive with an exclusive "or", designed to split the flow into alternative routes. During the process, only one of the suggested routes can be activated. Skip conditions are contained next to the designator line. Inclusive, OR - non-exclusive with logical "or" gate designed to split the flow into routes, where each is activated if the condition of the truth of the logical expression associated with it is met. Several paths can be taken in this process, but if at least one of them is not true, then the choice is impossible.
An analogue of a non-exclusive gateway is Complex (complex). The difference is that there is only one expression that determines the activation of a particular workflow. Parallel, AND - a parallel with logical "and" gateway is needed for branching or merging parallel operations. Exclusive Event-Based - An exclusive but event-based gateway that separates the workflow into alternative routes. Exclusive Event-Based Gateway to start a Process is also an exclusive gateway, the events on which it is based start the entire process. This is the start character of a process or subprocess that has no input streams. Parallel Event-Based Gateway to start a Process works in the same way - a parallel gateway, also based on events that start the process. However, with its help, you can activate several processes at the same time if the events associated with them work. Naturally, it has no incoming streams. The pictures clearly show the BPMN notation in the examples of diagramming with two kinds of gateways.

Data and streams
The data object is contained and used in charts specifically, which demonstrates the use of additional markers. Data Inputs - input data, that is, the initial information in order to start the execution of actions. Appears on the top edge of the symbol. Data Collection - a set of data, that is, an entire array or collection of data of the same type. Displayed below the symbol. The data object and the action are connected by a relationship using an association.
The standard workflow image can be supplemented in the diagram by indicating specific flows. Conditional Sequence Flow - designation of a conditional flow of operations when branching it. Shown as coming from an action (if you don't want to use a gateway in the diagram). Default Sequence Flow - the flow of operations that occurs by default, most often comes from a gateway or action, is not associated with logical expressions.
Examples and Conclusions
The start event, as the name implies, indicates the start point of a process. This is the starting point, which means the absence of any kind of incoming flow. The start event in BPMN notation examples is denoted by a circle in which the center is free. Such an event can be a letter or a call from a client, for example, sent to an online store or to the website of a company that models this business process. Further, the flow of operations goes along the lines and indicates the execution of the process up to the red circle, which indicates completion, the end event. By the way, there may be several of them, and it is easy to trace where exactly the flow of operations came to an end, completing the process. No outgoing flow from the red circle is possible.
If the diagram is not in color, then the end event is highlighted with a thick circle-shaped line. For example, in practice this event may be the issuance of an ordered product that has gone all the way from clearance through processing to issuance. In the course of all this work, the diagram shows the actions that were performed on the way from the start to the end event. The action is indicated by a rectangle with rounded edges. Gateways - rhombuses. This language is understandable to users, it is only necessary to slightly familiarize yourself with the display system that is present here in the illustrations.
to EPC
Let's continue our conversation about Business Studio. The capabilities of this system provide support for the full cycle of business development: from architecture design to finding ways to improve it.

Business Studio is simplicity and convenience
Business Studio is a business modeling system characterized by simplicity, convenience and high speed learning by experts. The presence of an intuitive interface of the system allows even beginners to start the process of designing a business architecture.
Modeling notations used
The program uses the most popular business process modeling notations that are understandable to employees without additional training:
1. IDEF0 notation
The most popular business process modeling notation based on the SADT structural analysis methodology.
The IDEF0 methodology is a modeling methodology that allows you to create a functional model that depicts the structure and functions of a system. And also - the flows of information and material objects that connect these functions. The figure below shows a graphic diagram in IDEF0 notation - an example is implemented in the Business Studio system.

Business processes in IDEF0 notation are represented in the form of a rectangle, and the arrows reflect the connection with other processes and the external environment.
Notation features are:
- the ability to decompose processes into subprocesses and, thus, build hierarchical models of business processes;
- selection of four types of arrows: three types of inputs (input, control and mechanism), which allow more flexible description of the logic of using inputs in the process for the purpose of subsequent analysis and output.
The IDEF0 notation is used to create the top level business process model. The construction of the top-level IDEF0 diagram provides the most general or abstract description of the modeling object. At the lower level, to describe the algorithm (scenario) of the process execution, it is permissible to change the IDEF0 standard to the notation Process, Procedure, EPC or BPMN 2.0.
The SADT methodology can be found in detail in David A. Mark and Clement McGowan's monograph "SADT Structural Analysis and Design Methodology".
2. Notation Process (Basic Flowchart B Visio)
This notation Graphical elements are used: event, process, decision, two types of arrows - precedence arrows and "Object flow" arrows.
The Process notation supports decomposition into sub-processes.

The Process notation can be used to model individual company processes, as well as at the lower level of a business process model created in the IDEF0 notation.
3. Notation Procedure (Cross-Functional Flowchart B Visio)
This notation is used to represent the process execution algorithm (workflow class notation). In addition to the graphic elements used in the Process notation, tracks (Swim Lanes) are used, denoting organizational units - performers of process actions.

Notation Procedure supports decomposition into sub-processes.
The procedure notation can be used to model individual company processes, as well as at the lower level of a business process model created in the IDEF0 notation.
4. BPMN 2.0 Notation
Used to represent the process execution algorithm (workflow class notation).
The peculiarity of the BPMN 2.0 notation, which appeared as a modeling standard in 2011, is that it is intended both for modeling business processes and for their execution.
It is easy to understand and convenient for both business analysts and developers who automate the execution of processes. To export a process diagram to a BPMS system, Business Studio uses the XPDL standard.
Business Studio provides 2 types of BPMN 2.0 diagrams - process diagrams and process interaction diagrams.
The following graphic elements are used:
- processes;
- developments;
- gateways;
3 types of arrows:
- control flow;
- message flow;
- associations;
- the documents;
- information;
- messages; databases.

It is important that in Business Studio all BPMN diagram elements are repository objects.
In Business Studio, in BPMN notation, you can build a hierarchical process tree, that is, decomposition is supported.
For the BPMN process, you can automatically generate regulations and other reports, this notation is mainly used to describe lower-level processes, especially those with complex execution logic.
5. EPC (Event-Driven Process Chain) Notation
Used to represent the process execution algorithm (workflow class notation).
A diagram described in EPC (Event Process Chain) notation is an ordered combination of events and functions.
For each function, initial and final events, participants, performers, material and documentary flows accompanying it can be defined. In EPC notation, branching arrows is done using operators.

The EPC notation supports decomposition into lower levels. An EPC decomposable function diagram can only be described in EPC or BPMN 2.0 notation.
EPC notation can be used to model individual company processes, as well as at the lower level of a business process model created in IDEF0 notation.
What notations do you use in your work?
I am often asked - what to read about business processes?
One of the best sites on the Runet is www.klubok.net. I myself "grew up" on the forum and articles on this site. Many articles have not lost their relevance even now. I recommend starting with him.
But if we talk about books, I can confidently say best book about business processes is a book written by Repin and Yeliferov: "Business processes of the company. Construction, analysis, regulation".
Description of business processes: striving for simplicity.
The article deals with the issues of choosing a notation for describing processes for the purpose of subsequent regulation. Frequently used Work Flow notations are compared with each other, such as: "Simple flowchart" in MS Visio, "Procedure" of Business Studio, ARIS eEPC notation and others.
When comparing notations, the focus is on creating simple and understandable process diagrams for employees of the organization.
For business analysts of companies, the theses discussed in the article are a serious reason to think about how effective the approaches they use to develop graphic diagrams of organizational processes are.
Introduction
One of the most important goals for the formation of graphic process diagrams is their subsequent use in the regulatory documents of the organization. As a rule, these schemes are used by employees who are not trained in complex notations, do not have system analysis skills, etc. For them, simplicity and clarity of schemes are very important. Complex, confusing schemes containing many different symbols are poorly perceived by people, which makes their practical use difficult. Therefore, for practical purposes, the correct choice and use of the notation (method) for describing processes is important. By what criteria should such a notation be chosen? How to compare different notations with each other? Let's look at some popular notations and try to answer these questions.
Notation ComparisonThe following process description notations were chosen for comparison:
- "Simple flowchart" (with displaying the movement of documents, using the "Decision" block);
- "Simple block diagram" (without displaying the movement of documents, without using "Solution" blocks);
- "Procedure" of the Business Studio system (one of options representation);
- ARIS eEPC.
A simple and intuitive process was chosen as a test case. The results of the description of this process are presented in fig. 1-4.
Rice. 1. Process diagram in the notation "Simple flowchart" in MS Visio (with the movement of documents, using the "Solution" block).
On the diagram of Fig. 1. The sequence of process operations in time is shown with thick arrows, and the movement of documents is shown with thin dotted arrows. Blocks "Solution" are used in a classic way. They display information (questions) on which the subsequent course of the process “depends”. This approach to the use of "diamonds" is very common. But in fact, the entire logic of decision-making and the formation of certain outputs (documents) should be contained within the operations of the process. If you think about it, the value (meaning) of drawing these "diamonds" is not obvious. What are these objects: process operations, events? It seems to be neither one nor the other. These are rather statements for making a decision on some condition. But after all, we are developing a process diagram for people, and not writing a computer program in a special language. AT computer program"diamond" would be a full-fledged operation for comparing conditions, etc. But on the process diagram, you need to show real objects - processes performed by people, documents, information systems, etc. Think about it, is it correct to show “diamonds” separately from the process operation on the diagram? Instead, you can:
a) describe the decision-making logic in the form of a sequence of operations on the scheme of the process under consideration;
b) describe the logic in the form of a diagram of the steps of the corresponding sub-process, moving to the level below;
c) describe the logic in text (in the text attributes of the operation) and subsequently bring it into the process execution schedule.
Let us formulate the “pluses” and “minuses” of the above (Fig. 1.) method of using “diamonds”.
| "Simple flowchart" in MS Visio (with the movement of documents, using the "Solution" block) | |
| "Pros" | "Minuses" |
|
|
On fig. 2. shows an example of the same process, only described without the use of "Solution" blocks and documents. It is easy to check that there are 24 less graphic elements in this diagram than in the diagram in Fig. 1. Scheme fig. 2. looks much simpler. From the graphic elements it does not dazzle, but from the point of view of informativeness, this scheme is quite understandable and accessible to the end user. If for each operation of the process the requirements for its implementation are described in text, then by combining the tabular and graphic form representation, it is possible to adequately describe the procedure for the execution of the process for the employees of the company.
Rice. 2. Process diagram in the notation "Simple flowchart" in MS Visio (without the movement of documents, without using the "Decision" block).
"Pros" and "cons" of the graphical representation of the process in the form shown in fig. 2. are shown below.
In general, the use of schemes in a format similar to that shown in Fig. 2 is convenient for both developers and employees working according to these schemes.
On fig. 3. the process diagram is presented, formed in the "Procedure" notation of the Business Studio modeling environment. The scheme has several features. Firstly, the "Decision" blocks are not used in a standard way - not as a graphic element for displaying a question and branching, but as a full-fledged decision-making process operation. In Business Studio, a “rhombus” has almost all the attributes of a full-fledged process, but cannot be decomposed (perhaps the system developers will make this possible in due course). Using a "rhombus" (instead of a quadrilateral) makes the diagram clearer. At the same time, any text information: description, start, end, deadline requirement, etc.
The second feature of the process diagram shown in Fig. 3., is the use of arrows. To display the sequence of operations, you can use an arrow with a single tip - the "precedence" arrow. You can use an arrow with two tips to show the movement of documents. But it is in Business Studio that you can use only one type of arrow - the "precedence" arrows. At the same time, you can bind to named arrows required amount documents that are defined in the directory of objects of activity. This approach makes it possible:
- significantly reduce the number of graphic elements on the process diagram, and at the same time:
- display the necessary information about incoming and outgoing documents in the process regulations.
Thus, without cluttering the diagram with unnecessary elements, we can nevertheless fully describe the process and upload all the necessary information to the regulations.
"Pros" and "cons" of the graphical representation of the process in the form shown in fig. 3. are shown below.
Rice. 3. “Procedure” of the Business Studio system (variant with non-traditional use of “Solution” blocks).
In the case of using Business Studio, the "Procedure" notation can be used in slightly different ways. The author of the article tends to the approach presented in Fig. 3.
On fig. Figure 4 shows a diagram of the process under consideration, developed in the ARIS eEPC notation. Note that some operations of the process did not fit on the diagram. This incomplete diagram of the simplest process, made in ARIS eEPC notation, contains four logic statements and eight events! The person reading the diagram must be able to correctly interpret all of these logical operators. Without special training and some skills in reading such diagrams, an ordinary employee is unlikely to be able to understand the logic of the process in question without a detailed textual description or the help of a qualified business analyst.
Note that the process diagram in the ARIS eEPC notation takes up significantly more space than the diagrams shown in Fig. 1-3. The complexity of the formation of such a scheme is also significantly higher.
| Process diagram in ARIS eEPC notation (built in Business Studio) | |
| "Pros" | "Minuses" |
|
|
In general, if you are not going to buy SAP R / 3, then the choice and use of the ARIS eEPC notation is not, from the point of view of the author of the article, the optimal solution. It is worth paying attention to more visual and intuitively understandable notation for process descriptions. However, for some, the ARIS eEPC notation may seem more clear and understandable. To a certain extent, it's a matter of taste.
Rice. 4. Process diagram in ARIS eEPC notation (built in Business Studio).
Description of the process for subsequent automation purposes
It is interesting to look at the process diagram in question if it is described in the BPMN 2.0 notation. This notation is intended to describe "executable" processes, i.e. processes supported by the BPM system.
Your opinion on using BPMN 2.0. shares A.A. Belaichuk - CEO"Business Console" company:
On fig. 5 shows the same process in BPMN notation. As we can see, this figure is similar to Figure 1: in BPMN notation, tasks are represented by rectangles, forks - by diamonds, data - by an icon similar to a document. Control flows are solid lines, data flows are dashed. It should be noted that only a small part of the BPMN notation is involved in this diagram: only one type of fork out of 5 available in the palette, one type of tasks out of 8. In addition to a wider palette, this notation is distinguished by the ability to model not only an isolated workflow, but also several processes interacting with each other through messages or data. In addition, this notation is more strict: it defines not only icons, but also the rules by which they can be combined with each other. The need for such rules is dictated by the fact that the BPMN notation is focused not only on the fact that people will read it, but also on direct execution by a special software- "engine" BPM-system. At the same time, as this example shows, when using a limited subset of the palette, BPMN is no more complicated than a familiar flowchart. Well, for those who want to master BPMN professionally, we recommend specialized training www.bpmntraining.ru. |
Rice. 5. Process diagram in BPMN 2.0 notation.
Life practice
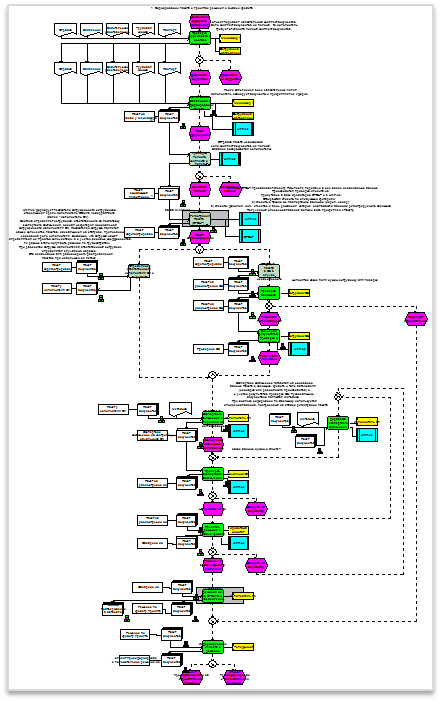
On fig. Figure 6 shows a fragment of a process diagram developed by business analysts of a very specific company in the notation they invented. The scheme is built using the principles of the "Simple block diagram" - the "Solution" block is used in its classic version. In addition, the diagram shows many other symbols used in a non-standard way.
When forming the scheme of Fig. 6, business analysts obviously "fought" for visibility and maximum clarity for the average user. They sought to minimize, or even eliminate, textual commentary on process diagrams. The performers simply printed an A3 format diagram, when reading which everything immediately became clear: what to do, how, what documents to use, etc.
The scheme under consideration is, of course, not an example of simplicity and clarity. But it was formed in order to convey the maximum of useful information to the executors of the process.
conclusions
So, it is obvious that when describing processes, one should strive for simplicity and understandability for employees.
The use of complex, formalized notations when describing processes leads to:
- difficulties in the use (interpretation) of schemes by ordinary employees;
- the impossibility (difficulty) of organizing work on describing processes by employees of departments who have not undergone special training;
- a significant increase in the labor costs of business analysts for the formation of schemes;
- additional difficulties in documenting circuits (large volume, etc.);
Therefore, do not clutter up the process diagram with various graphic elements. But if you use them, it is better that they carry useful information for employees, and were not simply a consequence of the formal application of modeling notations.
V.V. Repin, Ph.D., associate professor, Executive Director BPM Consulting Group LLC, head. Department of Business Process Management NOU HPE "IEF "Synergy", founder of the portal www.FineXpert.ru
It is these simple principles that I am trying to convey to business leaders who are fascinated by beautiful presentations. software products often forget that a simple checklist is often better than 10 pages of regulations.
On the Internet, you can find many reviews and discussions of notations for modeling business processes. Consultants and business analysts have long discussions about which notation is best to use when modeling enterprise business processes. From our point of view, discussion of notations without reference to a software product does not make sense. After all, a graphic diagram is just the tip of the iceberg, all business logic and relationships are stored “inside” the notation blocks and are not visible on the diagram.
For example, the now popular BPMN notation will truly reveal its advantages only in conjunction with a BPM system that can "understand" and "execute" the drawn business process diagram in real time. That is, using this notation, you can automate and control the execution of the process. If you just draw the process in BPMN notation in Visio and save it as a picture, then you will lose almost all the advantages of this notation over any other.
Now a lot of software products have appeared on the market that supposedly support several notations at once, but the fact is that in fact the logic of these programs is the same for any of these notations. As a rule, responsibility and documents are fixed inside the block, and then, in order to visually comply with the requirements of one of the notations, graphic blocks can be added to the diagram, the presence of which does not affect the functionality in any way. That is, in fact, you are building two models: one according to the logic of the program, and the second - to meet the requirements of the notation, and at the same time, these models may not coincide (what we see does not correspond to what is saved in the database).
Below is an example of a business modeling system that, on paper, supports the ARIS eEPC notation, but, in fact, responsibility is assigned to a function card, and graphic blocks are used “for beauty”.
But let's not criticize other people's developments, but instead consider the most popular notations on the market for modeling business processes, as well as their implementation in the Fox Manager program.
Top level processes
The most common notation for building top-level processes today is IDEF0(methodology of functional modeling) and ARIS VAD(value chain).
In Fox Manager, we did not adhere to the strict requirements of any notation, but simply created a process interaction diagram, which consists of blocks and arrows and shows connections, as well as inputs and outputs of processes in a visual graphic scheme. The advantage of our top-level process modeling approach is that such diagrams can be generated automatically by Fox Manager, watch a short video to understand how it works.
What is the difference between our scheme and IDEF0? First of all, in IDEF0 there are requirements for which side of the block which arrow should fit:
- the entry arrow always comes to the left edge of the activity
- control arrow - to the top edge
- mechanism arrow - lower edge
- exit arrow - right edge
Is this an important difference that gives this notation advantages over our approach? From our point of view, no, but if you wish, you can bring the interaction scheme in Fox Manager in strict accordance with the requirements of this notation (top - the original scheme in IDEF0, bottom - its analogue in Fox Manager).

As you can see, if you want, you can model IDEF0 schemas in Fox Manager as well.
The IDEF0 notation also has other requirements (which, however, are usually not observed by business analysts) - this is a limit on the number of blocks in the diagram (6-8) and the principle of dominance (the most important function should be in the top left corner). Again, there are no barriers to arranging blocks in this way in our program.
As for the ARIS VAD notation, it’s even simpler here: it’s enough to build processes along the value chain and, if you wish, show those responsible and interactions.

The picture shows an example of such a scheme in our program (on top - the original ARIS VAD diagram, on the bottom - its analogue in Fox Manager). Of course, you can find fault in the form of blocks, arrows or highlights, but in general, there is no doubt that in our program, if desired, you can build diagrams in accordance with the requirements of the ARIS VAD notation.
Lower Level Processes
In Fox Manage, we use a simple, visual, and very flexible notation to model low-level processes. You can get acquainted with its capabilities from the video.
There are many notations for modeling low-level business processes: Basic Flowchart, Cross Functional Flowchart, EPC and others. Most of them have minor differences from each other.
For example, if in the Fox Manager program on the diagram we collapse the blocks of responsible, documents and resources, then we will get an analogue of the notation basic flowchart(on the right is the original process, on the left is the analogue in Fox Manager).

If all the blocks on the diagram are expanded, then we will get an analogue of the process in the notation EPC. The great thing is that when using the Fox Manager notation, blocks can be collapsed and expanded dynamically without having to create a new version of the process in a different notation. The picture on the right shows the original process, and on the left is the analogue in Fox Manager.

Yes, of course, there are differences, for example, we used the control function as an event display, we also do not have separate blocks "Logical AND" and "Logical OR", but they can be easily replaced by another block (diamond) with the letter "X" or "V" inside.
Notation support Cross Functional Flowchart was added to the program in one of our free updates. This notation differs from the notations already discussed above in that you can show responsible people on it by tracks, and not next to the block. Unfortunately, this method has its drawbacks, when there are a lot of responsible people, the process becomes invisible and difficult to read. There are also problems when it is necessary to distribute responsibility for a function to two or more positions at once. Below is an example of such a process in Fox Manager.

As for the notation BPMN, then we believe that its capabilities are too redundant for the purposes of describing, analyzing and regulating business processes. This notation contains about 100 different blocks and their subspecies that are used in process automation, but they are useless for business modeling systems that cannot “execute” processes in real time, but take information from them to form regulatory documents.

Of course, it is probably possible to reduce the set of elements of this notation to the required minimum and try to adapt it for the purposes of regulation, but in this case we will lose its main advantage - the ability to execute processes with a BPM engine. At the same time, if only 5-10 necessary blocks are left, then, most likely, the appearance of such processes will be very similar to the notations we have already considered.
Conclusion
We believe that the Fox Manager program has chosen the optimal notations for modeling business processes, which are both easy to understand and have high functionality.
Notation support is implemented on the basis of the program core, we do not use Visio and other third-party components, so the speed of data processing from such flowcharts is very high.
The diagram can show many additional information, for example, next to the name of the function, you can display its type, frequency, time, and even cost, which is calculated dynamically in real time as the process fills up. At the same time, the appearance of the scheme can be customized for each user individually.
And in our process editor, you can track the changes that were made by users and display them in a table or display them graphically on a diagram.
If you do not have enough standard functionality, then you can expand the basic set of blocks for modeling business processes. For example, you can create blocks of risks or indicators and display them on a graphic process diagram.
But we are aware that some business analysts do not trust new developments and prefer to use the old, familiar notations. The purpose of this article is to show the flexibility of the Fox Manager program and the ability to customize appearance schemes for the requirements of most notations available on the market. Build business process models the way you want!


For beginners: breeding a broiler at home Boiled water for broilers
Only lovers will survive
Features of advertising aimed at children
retouching old photos in photoshop retouching old photos
What is an NPO: decoding, definition of goals, types of activities Does a non-profit organization have the right