The bonus begins with an assessment, you also need to remember the basic principle: the variable part of the salary is designed to stimulate labor activity and should encourage the achievement of above-standard results. And you should always remember that the bonus is not part of the salary. After all, the deprivation of the bonus in this case creates stress, conflicts and leads to demotivation of the staff.
The performance related pay (PRP) system is based on a staff assessment procedure based on key performance indicators (KPIs). However, in order to introduce such a system into management practice, simple and reliable methods should be developed that establish a relationship between the employee's KPI values and the value of the variable part of the salary.
Personnel assessment by KPI
Previously, our magazine published a methodology for assessing personnel by KPI, based on a combination of current assessment results and competencies of employees. Let us briefly recall its main provisions.
For each position in the organization based on service functions An employee develops two models (tables) - results and competencies. The first lists all performance criteria for performance evaluation: quantitative and qualitative, individual and team. In the second - the competencies required for this position: corporate (common for all staff of the company), managerial and expert (vocational). From these two models, 5-7 key indicators (of any type) are selected to assess the results and competencies of the employee in the coming month (quarter or other reporting period - depends on the position level) and are recorded in a personal performance table (see Table 1). At the same time, competencies are “equated” with the qualitative results of the employee’s activities. Each of the selected indicators, in accordance with the priorities of the immediate supervisor, is assigned a weight - from 0 to 1 (the total weight should be 1).
Table 1. Personal performance
|
Key indicators (KPI) |
The weightKPI |
Base |
Norm |
Target |
Fact |
Partial result, % |
For all indicators, three “performance levels” are set:
1. Base - the worst admissible value ("zero" point), from which the countdown of the result begins.
2. Norm - a level that must necessarily be achieved taking into account the circumstances (for example, the situation on the market), the characteristics and complexity of the work, and the capabilities of the employee. This is a satisfactory indicator value.
3. Purpose - above-standard level to which it is necessary to aspire.
At the end of the month (quarter), the actual KPI values are evaluated. At the same time, quantitative indicators are measured on a “natural” metric scale, and qualitative indicators are measured on an ordinal 100-point scale. With its help, you can be flexible in assessing quality KPIs by setting “reference points”, for example: base - from 0 to 20, norm - from 40 to 60, goal - from 80 to 100 points. At the same time, assessments must be “deciphered” so that employees understand exactly what results internal customers expect from them.
After evaluating the actual value of KPI, a particular result of work on this indicator is determined in accordance with the formula:
This result reflects the degree of fulfillment or overfulfillment of the norm. So, if the actual indicator is below the norm, then the partial result for it is from 0 to 100%. If the “fact” exceeds the norm, then the partial result is above 100%.
After evaluating each indicator, the employee's rating is determined. To do this, particular results (in percent) are multiplied by the weight of the corresponding KPIs and added together. The result is a "weighted average" performance ratio, reflecting (in percent) the overall performance of the employee for the reporting period, taking into account the importance and actual values of all his KPIs. If the coefficient is more than 100%, this indicates a person’s high performance (above the norm), if less, it means that the norm has not been achieved for some or even all indicators, and the overall result of the work is below the established level.
Next, you should link the received estimates and the amount of the employee's bonus. To do this, it is necessary to remember the basic principle of bonuses: the variable part of the salary is intended to stimulate the labor activity of people and should encourage them to achieve above-standard results. In Russian practice, there are cases when the bonus is actually considered as part of the salary and is paid “automatically” when the plan is fulfilled. If the employee does not reach the standard indicators, then he loses the bonus in whole or in part. This practice creates nervousness, stress, conflicts and leads to demotivation of the staff. The variable part of the salary should encourage people to achieve higher results compared to the normative ones. And for the implementation of the plan, the employee should receive a salary. It is important that the fixed part of the salary remains constant! Based on these considerations, we will consider two ways to calculate the bonus if the employee's KPI estimates are known.
The first way to calculate the premium
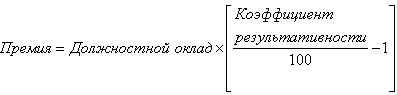
The variable part of the salary (performance bonus) is calculated as a percentage of the official salary using the employee's performance ratio according to the formula:
Of course, this formula is applicable only to those employees whose performance ratio is above 100%, i.e. who have reached above-standard indicators, taking into account the values of all KPIs and their weights. Otherwise, these persons do not receive the bonus. The amount of the payment is limited by the employee's bonus fund.
Consider an example. The work of the shop manager for the past reporting period (month, quarter, half year, year) was evaluated according to five key indicators (see Table 2).
Table 2. Premium calculation example (method 1)
|
Key figures |
Weights |
Base |
Norm |
Target |
Fact |
Result |
|
Volume of production |
3 million rubles |
5 million rubles |
6 million rubles |
5.5 million rubles |
||
|
Share of defective products |
||||||
|
150 thousand rubles |
90 thousand rubles |
60 thousand rubles |
75 thousand rubles |
|||
|
Performance ratio: |
||||||
|
Job salary: Performance Award: |
||||||
Suppose that the official salary of the head of the shop is 40,000 rubles. Then his bonus based on the results of work will be 9.3% of the salary: 40,000 rubles. × 0.093 = 3720 rubles.
As can be seen, for two indicators (“share of production by assortment” and “satisfaction of internal customers”), the results are below the standard. However, the overall result (109.3%) is above the norm, and therefore the employee is given a bonus based on performance.
Thus, the bonus is calculated as a percentage of the official salary, depending on the employee's performance ratio.
The second way to calculate the premium
The total performance bonus is calculated on the basis of the employee's bonus fund as the sum of "private" bonuses earned for each KPI separately. If the size of the bonus fund is known, then the maximum bonuses for all KPIs are first determined depending on their weights:
Then the actual premium for each KPI is calculated as a certain percentage of the maximum premium, depending on how much the actual value of this indicator exceeds the norm:
This formula is applicable only for those indicators for which the "fact" is greater than the "norm". Otherwise, the premium for this indicator is not charged. Then the private bonuses for all KPIs are added up, and the total employee bonus is displayed:
Let's go back to our example. Suppose that the employee's bonus fund is 40% of the official salary, i.e. 40 000 rub. × 0.4 = 16,000 rubles. Then, when using the second method of calculating the bonus, the personal performance table will be different (see Table 3).
Table 3 Premium calculation example (method 2)
|
Key figures |
Weights |
Norm |
Target |
Fact |
Max. premium |
Fact. premium |
|
Volume of production |
5 million rubles |
6 million rubles |
5.5 million rubles |
|||
|
Share of production by assortment |
||||||
|
Share of defective products |
||||||
|
Logistics costs |
90 thousand rubles |
60 thousand rubles |
75 thousand rubles |
|||
|
Satisfaction of internal customers |
||||||
In this case, the maximum bonus for each KPI is determined as a share of the bonus fund in accordance with the weight of this indicator and is accrued upon reaching its target value. For example, for the criterion "output": 16,000 rubles. × 0.35 = 5600 rubles. The same is true for other indicators. In addition, the actual premium for each of them is charged only if the "fact" exceeds the "norm". So, in the above example, for two indicators - "share of production by assortment" and "satisfaction of internal customers" - the standard is not met, so the premium is not accrued. For other indicators, the premium is calculated as follows:

If we add up the actual bonuses for all KPIs, we get the total employee bonus: 2800 rubles. + 800 rub. + 800 rub. = 4400 rubles.
Thus, the premium for each KPI is calculated as a share of the maximum premium, depending on how much the actual value of this indicator exceeds the standard one.
Choice of method
Let's figure out which of the two methods of calculating the premium described above is preferable.
First way - tougher for employees, because it hides a "penalty" for failure to comply with the norm for certain KPIs. If, according to these performance indicators, the result is less than 100%, then the performance coefficient decreases and, as a result, the employee's bonus decreases. Thus, the first way of calculating it stimulates people to a greater extent to pay attention to all indicators, and not just the most important ones. However, it should be borne in mind that the base KPI values should not be overestimated or underestimated. Otherwise, this may lead to the fact that the result (in percent) for these indicators will be inadequately high, if the "fact" turns out to be even a little more than the "norm", or too low - otherwise. It is clear that this will distort the performance ratio. In other words, the range between "base" and "norm" should be wide enough to increase the robustness of the valuation and premium calculation results.
Second way - softer and "democratic", because it does not imply a "fine". As noted above, the premium for indicators for which the norm is not reached is simply not charged.
On the one hand, this is good, because the threat of punishment to many people is annoying and demotivating. In fact, the "penalty" for not meeting the norm is a hidden deduction from the permanent part of the salary, which contradicts one of the basic principles of wages: the permanent salary must remain constant. If the standard is not met, one should not blame the person, but figure out why this happened. After all, in any organization everything is interconnected, and the reasons can be very diverse. And the award should not be a means of punishment for omissions, but an instrument of encouragement for achievements.
On the other hand, this is bad, because employees may simply ignore some indicators that they “do not like”, or do not make any efforts to fulfill their duties if they realize that they are not coping with the standard. Due to the fact that the "automatic" punishment is not included in the calculation of the bonus, the burden on the immediate supervisor increases. To avoid this, the leader must work with subordinates, find out the reasons for low results and motivate people in other ways, primarily intangible.
Recently, the scope of application for the procedure for assessing the productivity of employees has been expanded - it has become used not only for top managers. Evaluation of key performance indicators (KPI employees) has ceased to be hallmark foreign companies, examples from practice can be found in different industries and for a variety of categories of employees from marketers and business analysts to financiers and economists.
Managers are assessed by competencies by Aleksey Shirokopoyas, Development and Assessment Expert managerial competencies. Developer of educational and game programs. Project founder. 8-926-210-84-19. [email protected]
Typically, KPI-based motivation systems measure key indicators performance (KPI employees), because they are based on SMART criteria. Therefore, such motivation systems are convenient for applying to employees employed in profit centers, where there are objective, and most importantly, measurable criteria: sales volumes, financial key performance indicators (KPI employees), deadlines, etc., and work based on SMART -goals and objectives, has a specific result. However, not all types of work can have such goals and objectives. For example, how to evaluate process activities (which do not imply the achievement of a specific result), where there are no SMART tasks and those who are "remote" from the economic and operational processes of the company - "clerks": a secretary, a call center operator, system administrator support services, inspector personnel office work, accountant, personnel officer, etc.? These workers (back office) perform routine functions, and, unlike the work of managers, the work of "clerks" is difficult to evaluate. How to assess the quality side of the work of this category of personnel?
Key performance indicators (KPI employees) - what should I pay attention to?
In this case, it is necessary to evaluate the performance of functions. To a large extent, this is only a qualitative assessment, and, as you know, a qualitative assessment is expert assessment. The method proposed in the article helps to evaluate the work from this side.
Each leader appreciates in his employees the ability to perform work quickly and efficiently. And laments when these requirements are not met. Often he has to put up with this and hope that he will someday find a better employee, but everything repeats with a new employee. Why is this happening? To answer this question, let's delve into the nature of the parameters under consideration and their relationship.
What is "working speed"? From physics, we know that speed is the ratio of the amount of work to the time it takes to complete it. This means that the manager evaluates his employee according to three parameters: the amount of work, the time it takes to complete it, and the quality of the work.
Thus, any activity can be evaluated by three key performance indicators (KPI employees), let's call them the "efficiency triad" (see Appendix):
- Number of work- production rate, share of excess production, additional assignments in excess of the job description, etc.
- Quality of work– technology compliance, error-free, no customer complaints, defects, etc.
- Work completion time- compliance with the set deadline, early implementation, exceeding deadlines, etc.
Moreover, each leader can decide for himself what kind of work he evaluates:
- the number of operations per job function (for example, the function of a lawyer is the preparation of contracts, and the number of contracts is the number of operations in this function);
- the scope of functions in excess of the standard, which is defined job description(for example, a lawyer is required by law to process at least 100 contracts per month);
- solution of additional tasks, instructions of the head beyond official functions (projects, one-time tasks, etc.).
However, it is not so easy to "reconcile" the speed of work and quality. Indeed, one can be convinced that it is easy to implement only any two parameters of the “triad” and it is difficult to make sure that all tasks are completed on time, efficiently and in the right amount. It is difficult to balance such a system - and this is the responsibility of the leader.
Most often, the work is done efficiently and on time, but perhaps this will not be the entire amount of work. Often an employee manages to complete all tasks, but either with a decrease in the quality of some of them, or with violation of deadlines.
And you can completely forget about the expectations of early completion of all tasks while maintaining excellent quality to the authorities. Not only that, managers are accustomed to seeing an employee's ability to complete an increased volume of tasks ahead of schedule and with superior quality as signs of underutilization rather than talent. Isn't this the reason for the modern personnel trend of "talent search"? The employers' dream of so-called talent is the dream of employees who are able to sustainably fulfill these three criteria to the fullest. Agree, there are not so many of them.
In itself, accounting for tasks and functions is a creative matter. They have different significance, which means they should be with different weights. In addition, all key performance indicators (KPIs of employees) can have their own weight in the system (see Table 1), which is determined by the manager based on current tasks, work characteristics, etc., thereby highlighting what is most important. For example, timing is important for the recruitment department, and quality is important for the accounting department.
The final grade is calculated as a weighted average of grades. This is the sum of the products of the assessment for each of the key performance indicators (KPI employees) and its weight:
35% x 3 + 40% x 4 + 25% x 1 = 1.05 +1.6 + 0.25 = 2.9 (with a maximum of 4 points)
or
35% x 75% + 40% x 100% + 25% x 25% = 26.25% + 40% + 6.25% = 72.5%
The second option for calculating the final score of this technique is given in the Appendix.
It is worth repeating: naturally, such assessments are subjective. If the amount of work can be determined, and the timing can be measured, then the quality (in the absence of specialized measurements, for example, the number of customer complaints or the results of a technology assessment " Mystery shopper”) is judged subjectively.
Key performance indicators (KPI employees) - what increases the objectivity of the methodology?
Firstly, evaluation criteria are formulated in a special way. This was not done by chance: after a month, the manager cannot always remember in detail which deadlines were violated, and how many cases the employee completed with proper quality. However, he developed a general, holistic picture of the work of a subordinate, written in “large strokes”. With the same "large strokes" he is invited to draw a "portrait of efficiency" of the employee.
Secondly, the objectivity of the methodology increases the practice of its application. More than ten years of experience in using the methodology shows that the effectiveness is high when it is filled out by both the manager and the employee himself. They then discuss their results, and this makes a lot of sense:
- the employee remembers his tasks better, and the manager can forget something, confuse, because he has several subordinates;
- the manager has his own view on quality issues, while the employee tends to forgive himself for minor “sins”;
- the manager is often inclined to consider the violation of deadlines as low quality of work, confusing these concepts, and the employee may be proud of the quality of the work, while neglecting the value of meeting deadlines or volume.
Thirdly, by virtue of these effects, both sides strive to reach an agreement, which, as the satirists have formulated, is "the product of non-resistance of the parties." Since the main practical application of this method is the ability to regulate the monthly or quarterly premium (see Table 2), it is this circumstance that makes the technique valuable, because agreement leads to justice, and this is more important than the accuracy of measurements, and motivates more than mathematically accurate and sometimes impersonal scores.
Fourth, the objectivity of the methodology increases due to the “scale effect” if it is applied in all divisions of the company. This effect makes it possible to compare the result with objective data, and this is another powerful verification criterion and a source for correcting results. So, a senior manager, having received a complete picture of the assessments for the company (a set of performance assessments of managers employed in profit centers, and assessments of the effectiveness of employees of the company's cost centers), can compare it with financial and other objective key performance indicators of an employee (KPI of employees) of the organization's efficiency in in general. It may turn out that overall score of all employees according to the “Efficiency Triad” methodology will be overestimated compared to the objective key performance indicators (KPIs of employees) of the organization. Then the employer has the right to introduce a correction in the payment of bonuses by his authority.
Table 2 shows that employee Danilin had a vacation in February, and in accordance with the company's policy, no bonus was accrued during this time. Shirokova has a tendency to increase efficiency. For other workers, efficiency has declined.
Please note: the implementation of even 50% of the plan can be rewarded, especially since at the same time three key performance indicators (KPIs of employees) of the “triad” are difficult to achieve, and two out of three can be high due to the resource of the third. In this regard, any number less than 50% is also a definite achievement.

Key performance indicators (KPI employees) - systematic application of the method
The method can be applied in a cascade (when higher-ranking employees evaluate downstream ones), across the entire organization and regardless of whether employees have “objective key performance indicators (KPIs))” or not. The cascading application of the method gives the assessment a systematic and additional objectivity, especially when it comes to awarding bonuses.
And if, moreover, the method is applied for a long time, then it acquires a number of useful properties. Let's consider them.
- The higher manager, evaluating the lower one, at the same time evaluates the activities of his unit: after all, the results of the work of the manager are made up of both his personal efforts and the efforts of his subordinates. Dignity this method is that the superior gets the opportunity to compare data and draw conclusions about the effectiveness of the head and his subordinates, the unit as a whole, and even the management style.
So, the figure shows that the subordinates of the head of department 1 have different skills (this is clearly shown by the “mini-diagrams”): the engineer works slowly, but with high quality, the specialist works quickly, but not with high quality. The superior manager evaluates the work of the chief, and hence the entire department 1 as follows: the department solves a large amount of tasks with average quality and with some violation of deadlines. BUT general analysis the work of the entire department shows that the manager has an additional amount of tasks - in addition to those that his subordinates solve, and this may indicate problems with delegation. In addition, the activities of the boss somehow "worsen" the quality of the engineer's work and "slow down" the work of the specialist. As a result, the terms and quality of the work of the department are not above average. The head of the head of department 1, perhaps, should think about his effectiveness as a manager.
 The head of department 2 works quickly, but gives out fewer cases than his subordinate. Leading specialist slowly performs a large amount of work. This means that this boss takes on those tasks that can be solved quickly, while the quality of his work cannot be called low. Obviously, everything is in order here with delegation, quality of work and meeting deadlines, and hence with responsibility.
- Analysis of performance dynamics over time. It can be seen whether the performance of an employee increases during the probationary period or decreases over the years. The most illustrative picture is created by comparing the dynamics of efficiency assessments with other factors. So, in addition to the comparison of the level of efficiency with the vacation period shown in Table 2, one can see signs of an upcoming “burnout”, which are especially noticeable against the background of unchanged motivation, a drop or increase in efficiency associated with a change in leadership, the impact of corporate news on the productivity of employees or departments, and etc.
- Analysis of the work style of an individual employee: a comparison of different parameters of the "triad" will show the zones of its effectiveness and inefficiency. For example, one always works quickly, but not with sufficient quality, while the other solves only part of the tasks quickly and efficiently. From this, recommendations are born on the use of workers: the first one should be put in the area where speed is needed, and in relation to the second, one should also understand his motivation and interests in solving specific problems.
- Comparison of the ratings of employees allows you to judge their usefulness for the organization, and comparing the ratings of the heads of departments - to make a rating of departments and managers. So, at the end of the year, you can calculate the average or total annual estimates and determine who is more efficient and who is less and due to what factors: who is the “fastest” worker, who is the most “thorough”, who at the same time performs more tasks. At the same time, the content of labor and the employee's belonging to one or another unit do not play a role.
So, despite the obvious subjectivity of the Efficiency Triad method, its useful properties are obvious:
- the method is applicable to all positions, regardless of whether they are managerial or executive;
- employee performance evaluations can be accumulated and compared;
- accumulating estimates, you can track the dynamics of the work of individual employees and even departments, monitor the onset of "burnout", draw conclusions about their strengths and weaknesses;
- comparing the assessments of subordinates with the assessments of the manager, one can draw conclusions about the management style, identify areas of inefficiency in departments;
- due to the standard approach, the methodology is easily implemented in document management systems (Lotus Notes, MS Outlook, etc.) and ERP (based on Oracle, SAP, Microsoft, etc.), which are widely used in the corporate world;
- the method can become an addition or a common format for existing systems for assessing the effectiveness and efficiency of MVO, key performance indicators (KPI employees), bring their data to a single view.
And most importantly, this is not just another “precise tool”, but a way to mediate a dialogue between a manager and a subordinate on the issue of remuneration. After all, nothing reduces employee motivation as much as the lack of recognition and understanding of development paths. In such a dialogue, the employee can understand what his boss is dissatisfied with and what he pays attention to. In other words, the method gives motivation a very important managerial effect - feedback subordinate about his work.
should be calculated to diagnose corporate problems. Key performance indicators of an employee allow you to take timely measures to improve the efficiency of his work.
Hello! In this article, we will talk about the KPI system.
Today you will learn:
- What is KPI.
- How to calculate this indicator.
- How to implement a KPI system in an enterprise.
- About the pros and cons of this system.
What is KPI in simple words
KPI - this is a coefficient that determines the effectiveness of a particular enterprise: how well it functions, whether it achieves its goals.
The decoding of this abbreviation is as follows - Key Performance Indicators, which is usually translated into Russian as "key performance indicators".
If translated literally, the word “key” means “key”, “essential”, “indicators” - “indicators”, “indicators”, but with the word “performance” there are difficulties in translating, since it is difficult to interpret it unambiguously here. There is a standard that gives the most correct translation of this word, dividing it into two terms: efficiency and effectiveness. Efficiency shows how the funds spent and the results achieved are related, and performance - to what extent the company managed to achieve the result that was planned.
Therefore, it is more correct to translate KPI as “a key performance indicator”. Speaking in simple terms, so to speak, for dummies, you can see that this system helps to figure out what measures need to be taken to improve efficiency. Efficiency covers all the actions performed for a set time period, as well as the benefits received by the enterprise from each individual employee.
KPI indicators are as follows:
- Performance KPIs- shows the ratio of the spent money and time resources with the achieved result;
- Cost KPIs- shows how many resources are involved;
- KPI result- illustrates the result obtained during the execution of tasks.
Because this system is not easy to implement, you should adhere to certain rules and principles that can become indispensable assistants when switching to KPI:
- The 10/80/10 rule. It states that a company must define 10 key performance indicators, 80 performance indicators, and 10 performance indicators. It is not recommended to use many more KPIs, because this is fraught with overloading managers with unnecessary unnecessary work, and managers will certainly attend to finding out the reasons for not meeting indicators that have little effect on performance at all.
- Coordination of production indicators and strategic plan. Indicators production activities have no meaning unless they are correlated with the current Critical Success Factors (CSF) combined in a balanced scorecard (BSC), and .
- Manageability and controllability. Each division of the company responsible for its indicator must be provided with resources to manage it. The result must be controlled.
- Integrate performance measurement, reporting, and performance improvement processes. It is necessary to introduce a procedure for evaluating indicators and reporting that will push employees to the required specific actions. For this purpose, reporting meetings should be held to consider the issue being resolved.
- Partnership. In order to increase productivity successfully, it is worth building partnerships between all involved employees. Therefore, the implementation method new system need to be developed together. This will allow everyone to understand what the advantages of innovation are, as well as to be convinced of the need for change.
- Transferring efforts to the main directions. In order to increase productivity, it is necessary to expand the powers of specialists: help in, offer to develop their own KPIs, provide training.
How to calculate KPI
Paragraph 1. To calculate KPI, you need to select from three to five performance indicators, which will be the criteria for evaluating a specialist. For example, for an Internet marketer, they might be as follows:
- The number of visitors to the site attracted by the specialist.
- A figure that shows how many purchases were made by customers who have previously contacted the company.
- The number of commendable recommendations, customer responses in social networks or on the organization's website after purchasing a product or service.
- new customers - 0.5;
- buyers who made a second order - 0.25;
- positive recommendations - 0.25.
Point 3. Now you need to analyze the data for all selected indicators for the last six months and draw up a plan:
| KPI | Initial value (average monthlyindicators) | Planned value |
| Growth of new customers | 160 | 20% increase or 192 new customers |
| Percentage of repeat customers | 30 | 20% increase, or 36 repeat purchases |
| The share of customers who wrote a positive feedback, recommendation | 35 | 20% increase, or 42 reviews |
Item 4. The next step is to calculate KPI indicators in Excell. It is necessary to use the KPI calculation formula: KPI index = KPI Weight * Fact / Goal.
| Key indicators (KPI weight) | Target | Fact | KPI index |
| KPI 1 (0.5) | 20% | 22% | 0,550 |
| KPI 2 (0.25) | 20% | 17% | 0,212 |
| KPI 3 (0.25) | 20% | 30% | 0,375 |
| Performance ratio | 1,137 | ||
| 113,70% | |||
Here, the goal is the indicator that the employee must achieve according to the plan, and the fact is what he has worked out in reality. The final indicator is 113.70%, this is a good result, however, if we look at the table in more detail, we can see that the marketer did not fully comply with the planned standards.
Item 5. We calculate wages. We will be based on the fact that the total earnings of a marketer are $800, of which the fixed part (salary) is $560, and the variable (bonus) is $240. For a 100% index, the employee is entitled to a salary and a full bonus, but due to the fact that the plan is overfulfilled, the marketer will receive additional bonuses in the amount of 13.7% of the bonus part, that is, $ 32.88. As a result, the employee's salary will be $560 + $240 + $32.88 = $832.88.
But when an employee does not fulfill the plan, and his performance indicator is below 99%, then the size of the bonus is proportionally reduced.
With the help of such calculations and drawing up a table, you can see the problems and difficulties that an Internet marketer faces.
Poor performance may be due to the fact that the plan is drawn up incorrectly or the loyalty strategy itself is incorrect. The problem area needs to be controlled, and if things do not improve over time, then the right way out of the situation is to change the performance indicators.
Thanks to this approach, an understanding of the principle of operation of KPI is formed. Focusing on the goals, the calculation can be supplemented with new values. This can be a system of penalties, the number of solved and unsolved problems, and much more. For example, if the work according to the plan is less than 70% done, the employee will not receive a bonus at all.
There is also an alternative way to calculate salaries in relation to the percentage of the plan completed:
| KPI index | Premium coefficient |
| Below 70% | 0 |
| 70 — 80% | 0,6 |
| 80 — 89% | 0,7 |
| 90 — 95% | 0,8 |
| 96 — 98% | 0,9 |
| 99 — 101% | 1 |
| 102 — 105% | 1,3 |
| 106 — 109% | 1,4 |
| Over 110% | 1,5 |
KPI in practice
KPI-performance indicator is used by almost all companies that are engaged in direct sales. Consider some examples for a sales manager. Having adopted the approved key indicators, he will see a clear picture of his activities: it will become clear to him how much goods need to be sold in order to reach a certain income, which ones.
For an insurance consultant who is new to his profession, the optimal performance indicator would be 1/10: to sell one insurance policy, you need to meet with 10 potential buyers.
There is also a result KPI, for example, “the number of new customers is not less than n”, “sales volume is not less than n”, etc. These indicators are personal, and it is better when their number is less than 5, and most importantly, they should be easily measurable and clearly articulated.
In addition to motivating employees, company leaders use KPI as a tool to analyze the work of their subordinates.
This system allows you to clearly see the gaps in activities and at what stage they arose. For example, the boss keeps track of the manager's client base, how many calls and meetings the employee makes. If these indicators are met in sufficient volume, but there are few sales, it can be concluded that the employee lacks certain knowledge, skills or personal qualities for successful work.
KPI and enterprise planning
KPI indicators can be used in planning and monitoring activities. After the work has been done, the actual indicators are measured, and if they seriously deviate from the planned ones, better side, then the analysis and adjustment of further activities is carried out. Since all indicators are "dictated" by the real process, and not invented independently, such planning will contribute to the achievement of the necessary goals of the organization.
How to motivate staff to achieve KPIs
Thanks to the use of the KPI system, planned and actual indicators are recorded when paying for labor. This gives the manager a clear understanding of how to motivate an employee and for what. At the same time, the employee also clearly sees the pros and cons of his work and is aware of what actions can bring him a reward, and for what a penalty is due.
For example, an insurance consultant sold more insurance policies than planned and expanded the client base with many new clients. Thus, he exceeded the plan and, in addition to his salary, he will receive a bonus in the form of a bonus. On the other hand, if the same manager sold much less policies than planned, he may lose the bonus altogether and receive a “bare” salary, because his personal performance will be low.
However, you can motivate employees not only with money.
For the achievement of indicators, you can be rewarded with interesting trainings paid for by the company, unscheduled days off, gifts and other “carrots” that will inspire the employee no worse than money. But in this case, the employee's salary is always fixed, and according to the KPI system, points are calculated that the employee can exchange for the desired bonuses.
To create a KPI for employees, you need to focus on a common goal for all employees and strong motivation. Working in a team of interested specialists, like clockwork, can lead the company to achieve all its goals in a short time.
When is KPI not needed?
In a young company that has just begun its existence, it is not advisable to introduce a KPI system. The management system has not yet been formed here, and successful development is due to the work CEO. Most often, he also performs the functions of specialists in finance and personnel.
And also, you should not implement KPIs in those departments that, because of this, may adversely affect other departments of the company. For example, an IT service, whose representatives must solve the problems posed to them (repair of office equipment) as soon as possible. After all, it happens that one of the employees' computer failed, and the work stopped, and the entire department depends on the work of this employee.
If the salary of an IT specialist is calculated according to the KPI system, then he will not immediately go to work. First you need to make a request for the elimination of damage. This application must be approved by a senior specialist of the IT department, after which the task is queued for implementation and awaits consideration.
As a result, a task that takes 5 minutes to complete takes much longer, during which the work of the entire department, where one computer has broken, does not move at all.
That is why it is useful to implement a KPI system wisely, otherwise it can do much harm.
Mistakes when implementing KPIs
The most common mistake is introducing KPIs for statistics alone.
Ultimately, it turns out that the indicators of one division have no connection with the indicators of another.
For example, the supply service of one enterprise needed to cut costs. Therefore, in order to receive raw materials at a discount, employees purchased them in large volumes, and also purchased defective goods. This led to the overcrowding of warehouses, the freezing of finances in raw materials, which blocked all the advantages.
Meanwhile, the production department had its priority indicator - the load factor production equipment. To make efficient use of time, employees churned out certain products to save valuable minutes on machine tool conversions. But this inevitably affected the implementation of the sales plan by the commercial department, because there was no necessary assortment, and in a specific period of time the client could purchase only one type of product.
As a result, a situation has developed where everyone pulls the blanket over themselves, and no one reaches the goal. The result was reduced to zero, and all the work was done in vain.
Another common mistake is focusing solely on material indicators that are the result: sales, income, and so on. However, only when key indicators are not financial, but proactive in nature, it is possible to achieve goals much more effectively.
For example, how many calls should a sales manager make, how many meetings should be held, how many contracts should be concluded in order to achieve the same resulting KPI? It is on the basis of such non-financial factors that the system of employee motivation should be built, and the heads of departments should be guided directly by financial ones.
And also a serious mistake will be the situation when the persons responsible for this or that indicator are not indicated. For example, the order of incentives does not imply bonus payments or their reduction by the head for the performance or non-performance of the plan. In this case, the boss cannot be responsible for the actions of subordinates, because he has no way to influence them.
Pros and cons of implementing a KPI system
Working on a KPI system has many advantages:
- It has been established that in companies with such a system, employees work 20-30% more efficiently.
- Specialists will clearly understand what tasks are priorities and how to accomplish them.
- With a well-implemented system of indicators, the control of the company's activities is greatly facilitated, due to which problems are detected already at the stage of their occurrence and are solved without having time to cause harm.
- When calculating wages the principle of justice applies: those who work diligently get more. This allows the organization to retain valuable staff.
- The wage fund becomes a means of motivating staff, and not the main source of expenses.
There is a KPI system and disadvantages. First of all, the disadvantage is that a lot of time and effort is spent on implementation, because all indicators need to be worked out in detail. Most likely, it will be necessary to retrain employees, explain to them information about changing working conditions and new tasks.
However, the main drawback is that the effectiveness in the end is not always evaluated correctly. This can be avoided if, at the stage of system development, the criteria by which the qipiai will be assessed are flawlessly formulated.
1. What is a KPI?
KPI (Key Performance Indicators) - "key performance indicators", but more often translated as "key performance indicators". KPI is one of the tools with which you can analyze how effectively the staff works to achieve the company's goals.
KPI indicators are often used by larger companies (not where the owner, director, seller and loader are the same person), but vice versa when the company has a large number of employees and branches. The use of "kipiai" greatly simplifies the control of the efficiency of all departments of the company. Having key performance indicators, we get the opportunity to manage the process and make changes to it. Set goals for staff and motivate them to achieve them.
Let's look at an example of key performance indicators. You are the owner of a large store household appliances and you have 12 sales managers on your staff. The performance of each manager for a month can be assessed according to the following criteria:
- what % of the customers the manager interacted with made a purchase;
- average check of clients;
- fulfillment of the sales plan (for example, the minimum bar for a month is 350,000 rubles, and the manager’s salary will depend on how much% he exceeds the plan);
If, for example, you need to sell blenders of a certain model, you can set a minimum plan of 5 units for each manager, if more, then the seller receives 3% of its value from each “extra” unit. Thus, the goal is achieved to sell a certain product and motivate managers for this. As practice shows, optimal amount KPI criteria for one employee - from 5 to 8.
2. Types and principles of KPI
Types of key performance indicators:
- KPI of the result - quantitative and qualitative indicators of the result;
- Cost KPI - the amount of resource costs;
- KPI of functioning - how the execution process corresponds to the established algorithm;
- Performance KPIs are derived indicators that characterize the ratio of the result obtained and the time spent to obtain it;
- Efficiency KPIs (performance indicators) are derived indicators that characterize the ratio of the result obtained to the cost of resources.
There are principles to follow when developing key performance indicators. The cost of measuring performance indicators should not exceed the managerial benefit from using the indicator. After all, you won't hire a person who will count the number and duration of the manager's calls, the result will not justify the costs. For a more accurate result and the possibility of comparison, the indicators should be measurable and as simple as possible, understood by each unit in the same way, in order to avoid misinformation. And, most importantly, that KPIs are necessary, if we do nothing based on the results of their measurement, then in this case they are meaningless.
3. Pros and Cons of KPIs
Key benefits of the KPI include:
- fairness, transparency and comparability of results (management and staff see who works and earns how much);
- adjusting the work of an employee according to a lagging indicator;
- involvement of personnel in achieving the goals of the enterprise;
- quality control of the performance of duties.
Despite all positive sides KPI systems - it is not universal. Not all indicators in the work of personnel can be measured quantitatively, and therefore each business has its own ways of assessing efficiency, and finding them will require a lot of time, labor and finances.
4. How to calculate KPI. Example
There is no single formula for calculating KPI, since each company has its own specifics and, therefore, its own “kipiai”. Let's take an example of the calculation of the salary of a sales manager, taking into account his KPI in the Kotelok online store. The rate is 7,000 rubles. + 2% of personal sales (800,000 * 0.02 = 16,000 rubles) + bonus for fulfilling the plan by the number of new customers (2,000 rubles) + bonus for fulfilling the enterprise plan (for example, the plan is 100% completed - 5,000 rubles , by 70% - 3,500 rubles) in our case, by 80% - 4,000 rubles. In total, at the end of the month, the manager will receive a salary of 29,000 rubles. This scoring system motivates managers to sell to existing customers and attract new ones.
5. What is KPI in sales
In the field of sales, the main key performance indicators for the sales manager and the sales department are:
1. Sales volume. The manager is set a plan for a certain period of time (month, quarter, year). For example, in March, the manager must make sales for 1,300,000 rubles.
2. Number of sales. The number of customers who made a purchase (number of receipts).
3. Traffic. The number of customers who have learned about your product are potential buyers. Of course, attracting traffic is the task of marketers, but the seller himself can also influence the flow of customers, for example, using word of mouth.
4. Average check. Implemented to encourage the manager to sell additional goods. For example, purchase a heat-resistant glass plate or baking dish for the oven.
You can develop a KPI system on your own, but this will require a lot of effort and eat more than one dog. Majority large companies Still, they prefer to entrust the construction of the Kipiai system to professionals with extensive experience in this field. If you need help implementing KPIs in your company, please contact us, we will be happy to help!
Utenin Vladislav Viktorovich
(Excerpts from the book Slow Action Business, Or Practical Solutions Practical Solutions to improve the efficiency of the organization”, Utenin V.V., 2010, Alpina Publishers”)
After the percentage of completion of the plan is set, you need to determine what meaning the result has for the company. In other words, is achieving 94.3% of your monthly sales target a good thing or a bad thing? This meaning is reflected by the value of the coefficient and directly affects the employee's salary.
The spread of percentages of the plan and the values of the coefficients (meaning) is determined by the company independently (they are influenced by: the amount of salaries for a given position, the result to be obtained, the specifics of the market and the company's product, goals, mathematical calculations of payroll standards).
For an example and further calculations, we will set our own percentages of the plan, the coefficient values and their meaning (table 19).
Table 19. Percentage of indicator completion and coefficient (example)*
* - this table is a sample. The coefficients are given as a possible option.
** - the coefficient is set depending on what policy exists in the company regarding overfulfillment of the plan. A coefficient of 1.5 or 2 means that the employee is motivated to significantly overfulfill the plan. If there is no such task, then the value of the coefficient = 1 will serve as a limitation for the employee - he will not underestimate the plan in order to overfulfill it later, since in this case he will receive a coefficient corresponding to the fulfillment of the plan by 100%, and not more.
Examples of possible key indicators and the values of their coefficients for the subdivisions "Department / Department of Development trading network”, “Logistics department/department”, “Personnel department/department” will be given at the seminar. Also, KPI examples (billets) can be downloaded for free on the website www.emtway.ru in the "Ready-made solutions" menu.
Perhaps in these lists you will find several indicators that are relevant to your company. This is an example that a metric can be defined for any process in a company. But no matter how much you would like, you should not use all of the listed KPIs in the motivational scheme of one employee.
In a motivational scheme, it is optimal to use 3-5 KPIs.
Principles for the formation of a motivational formula
The standard motivational formula is:
Salary = fixed part (salary) + variable (changeable) part
If bonuses are provided, then:
Salary = fixed part + variable part + bonus
The ratio between the fixed and the variable part will differ depending on the goals, the situation in the company and the specifics of the market in which the company operates. For example, if you are just launching a product on the market, you need an aggressive scheme in which the fixed part can be 30% of the planned income, and the variable part, respectively, 70%.
Example
Suppose the average salary in the market for the position of "sales manager" is 30,000 rubles per month. It can fold in different ways. For example, 30% of the fixed part, that is, 9,000 rubles, and 70% of the variable, that is, 21,000 rubles. Total: 30.000 = 9.000 (fixed part) + 21.000 (planned amount of the variable part). This is an aggressive scheme that can be used, for example, when introducing a product to the market.
If the company already occupies the desired market share and the task is to keep it, the situation in the company and the market is stable, then the fixed part can be equal to 70%, and the variable 30%. In this case, 30.000 = 21.000 (fixed portion) + 9.000 (planned variable portion).
This is a rare case when the amount changes due to a change in the places of the terms, because the total sum of the variable part will vary in different ways.
For further examples, let's take the ratio of fixed and variable parts in wages "50 to 50", that is: 30.000 = 15.000 (fixed part) + 15.000 (planned amount of the variable part).
Influence of key performance indicators (KPI) on the variable part of wages
Define key performance indicators for the required position, for example:
- KPI1 - % of sales plan fulfillment.
- KPI2 - % completion of the work plan.
To establish the extent to which each of the selected KPIs will affect the variable part, we determine the contribution (weight) for each of them (table 20.1.).
Table 20.1. Influence of the indicator on the variable part of wages (example)
As can be seen from table 20.1., Both indicators affect the variable part of the salary equally. This means that achieving each of them is equally important.
Table 20.2. Indicator coefficients depending on the percentage of plan completion
To simplify further calculations, we will set the same values of the coefficients for KPI1 "sales plan fulfillment" and KPI2 "work plan fulfillment" (table 20.2. will be suitable for calculating each of the indicators).
Possible scheme for calculating the variable part (PV) of wages
IF = planned amount of the variable part x (KPI1 weight x KPI1 coefficient + KPI2 weight x KPI2 coefficient).
Checking all possible salary options for all possible KPI values (with a detailed explanation for some values)
| KPI1/KPI2 | 51-89% | 90-100% | >100% | |
|---|---|---|---|---|
| 15,000 (option 4) | 18 750 | 22 500 | 26 250 | |
| 51-89% | 18 750 | 22,500 (option 3) | 26 250 | 30 000 |
| 90-100% | 22 500 | 26 250 | 30,000 (option 1) | 33 750 |
| >100% | 26 250 | 30 000 | 33 750 | 37,500 (option 2) |
Option 1.
Implementation of the sales plan 90-100% (KPI1 = 1).
Implementation of the work plan 90-100% (value of the KPI2 coefficient = 1).
The variable part is 50% and is equal to 15,000 rubles.
IF \u003d 15.000 rubles x (1 * 50% + 1 * 50%) \u003d 15.000 rubles.
Salary per month = 15.000 (fixed part) + 15.000 (variable part) = 30.000 rubles.
Conclusion: the employee receives a planned salary established according to the payroll standard.
Option 2.
Fulfillment of the sales plan by more than 100% (the value of the coefficient KPI1 = 1.5).
Fulfillment of the work plan by more than 100% (value of the KPI2 coefficient = 1.5).
IF \u003d 15.000 rubles x (1.5 * 50% + 1.5 * 50%) \u003d 22.500 rubles.
Salary per month = 15.000 (fixed part) + 22.500 (variable part) = 37.500 rubles.
Conclusion: the employee receives 7,500 rubles more than the planned salary, but the implementation of the plan for each of the indicators is more than 100%.
Option 3.
Fulfillment of the sales plan 51-89% (KPI1 = 0.5).
Implementation of the work plan 51-89% (value of the KPI2 coefficient = 0.5).
IF \u003d 15.000 rubles x (0.5 * 50% + 0.5 * 50%) \u003d 7.500 rubles.
Salary per month = 15.000 (fixed part) + 7.500 (variable part) = 22.500 rubles.
Conclusion: the employee receives 7,500 rubles less than the planned salary.
Option 4.
Implementation of the sales plan is less than 50% (the value of the coefficient KPI1 = 0).
Implementation of the work plan is less than 50% (the value of the KPI2 coefficient = 0).
IF \u003d 15.000 rubles x (0 * 50% + 0 * 50%) \u003d 0 rubles.
Salary per month = 15.000 (fixed part) + 0 (variable part) = 15.000 rubles.
Conclusion: the employee receives less than 15,000 rubles, because. the variable part is equal to 0 due to the implementation of the plan for each indicator is less than 50%.
Calculate how much wages will be accrued if the implementation of the sales plan is 101%, and the implementation of the work plan is 49% (the correct answer is 26,250 rubles).


Only lovers will survive
Features of advertising aimed at children
retouching old photos in photoshop retouching old photos
What is an NPO: decoding, definition of goals, types of activities Does a non-profit organization have the right
Gleb Nikitin First Deputy